Indian economy is a developing market economy. It has the 5th largest economy in terms of nominal GDP and the 3rd largest economy in terms of purchasing power parity. After 2000 India has shown the annual average GDP growth 6% to 7%. India’s GDP reached 2.72 trillion USD is 2018-19. The foreign trade of India includes imports and exports of goods and services. Total exports inclusive goods and services are 491.64 billion and total imports inclusive of goods and services are 559.45 billion. Foreign trade accounted for 43.13% of India’s GDP in 2018.
According to India import-export data, India exports approximately 7500 commodities to 190 countries and imports 6000 commodities from 140 countries. The export of commodities in India was 292.91 billion dollars. Total exports from India registered 2.13% growth. Imports from India to commodities were 463.03 billion USD. India’s trade deficit narrowed to 9.76 billion USD in March 2020. Trade deficit 2018-19 was 176.6 billion USD. The data revealed the US overtook China to emerge as India's top trading partners with 68 billion USD while trade with China was 64.94 billion USD.
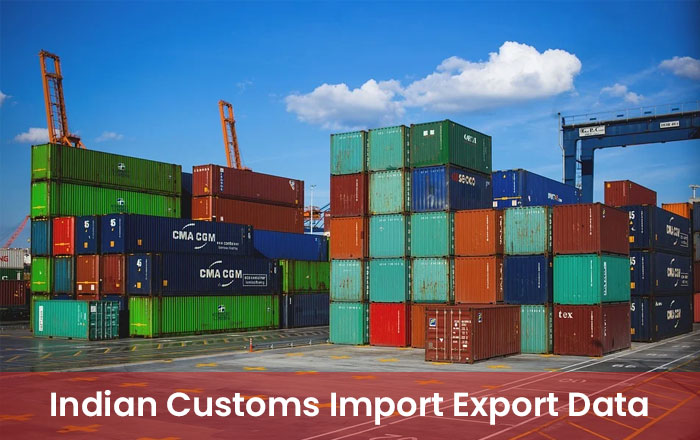
India import-export data is collected from custom ports across the country. Custom ports include data collected at custom points in airports, seaports, land, and ICD (Inland Container Depot). The custom data is collected from information available in the bill of lading given to Indian custom officials at different entry points. The Indian customs import export data contains the following information:-
Indian custom import and export data are used by the Government of India, national and international agencies, trading companies involved in import and export, bankers, and logistical companies.
Importers and exporters use the data to refer to the Indian import-export data while making their business plan and business projections.
They study the data and identify trends and changing customer preferences and tastes.
The data provides a ready reckoner of international rates for their product. Exporters will be able to price their product competitively while importers will be able to find products at the best rates.
Foreign trade is very volatile and is constantly impacted by international events such as wars, international sanctions, and trade wars.
It helps importers and exporters to find alternate sources to source or sell their products.
The database can help form the first point of contact for importers and exporters.
Importers and exporters can look for alternative products to expand their business.
The Indian government uses Indian customs import export data:-
Logistic providers can use the data to find new clients. Logistic providers are a vital link in the import or export of commodities. Information about ports will also be useful. Bankers also use the database to find new clients. Bankers provide institutional support to traders by giving Letters of Credit and Bank Guarantees to traders.
India Custom Export Data showed total exports 292.91 billion USD 2019-20. It is the 17th largest exporter in the world. Exports slumped at 34.27% in March 2020 as the Coronavirus has hurt global demand. While the export of services in the same financial year 198.73 billion USD.
The last five years saw exports an increase in exports at an annual rate of 1.2%.
India’s top exports in 2019 are -
The top ten exports in India accounted for 60.2% of the total global exports. Machinery was the fastest-growing segment showed a 23% jump from 2018-19. Pharmaceutical also showed an impressive 12.5% jump. Unknitted and non-crocheted clothing accessories were the third-fastest segments that grew at 6.4%.
The sectors which showed a decline were gems and precious metals showed an 8.7% fueled by a drop in the sale of diamonds, coins, and precious metals. Vehicles and iron and steel sectors also a decline of 6% and 3.1% respectively.
India Custom Export Data showed that 47.8% of India’s commodities were exported to Asia.
While 19.3% of the goods exported was to Europe. 18.8% of the merchandise was exported to North America.
The top export partners of India are:-
India Custom Import Data showed total import was 463.03 billion dollars 2019-20. India is the 11th largest importer in the world. Imports have decreased annually at a rate of 1.6%. Import plunged 28.72% to 31.16 billion USD in March 2020 fueled by countrywide lockdown due to Corona. Oil imports fell by 15% while non-oil imports fell by 29.09%.
India’s top imports in 2019 were:-
The top imports in India accounted for 79.4% of the total imports. Fertilizer was the fastest-growing sector grew at 23.3%. Imports from machinery including computers grew at 1.6%.
The sector which showed a drop in imports was organic chemicals a 9.3% decline, mineral fuel including oil 9.3% and gems, and precious metals 7.8%.
India Custom Import Data showed that 60.9% of India’s imports were from Asia. While India imported 15.9% of its commodities from Europe and 9.2 % of the merchandise was imported to North America.
The top import partners of India are:-
India has one of the largest peninsular in the world. India’s ports are extremely busy. The ports have emerged as a global hub for imports and exports. India has 13 major ports and 200 minor ports.
The top 10 ports in India are:-
Where MMT is million metric tons.
Top Traders in India are:-
Seair Exim Solutions is a leading export import data provider company. It offers updated, 100% genuine, and reliable global trade data of more than 80 countries of the world such as India, USA, Russia, Kenya, Mexico, Indonesia, Sri Lanka, Vietnam, Pakistan etc. Our major services are USA imports data, India import data, Indian export data, import data Indonesia, Vietnam export data, Russia customs data, Mexico trade data, Kenya shipment data etc. You can find various free resources related to import export business like HS code list, HS code search, HS code Finder, sac code list, sac code finder, custom duty in India, custom duty calculator, foreign ports, trading partners of India, GST rates in India, GST rates list and many more on our website –seair.co.in.
For free sample data report and free live demo data search
Phone No: +91-11-41325515, +91-9990020716
We have successfully served many reputable clients for Import-Export Data Information Services. Here are some of our clients:
Copyright © 2009 - 2024 www.seair.co.in. All Rights Reserved.


Leave a Comment