
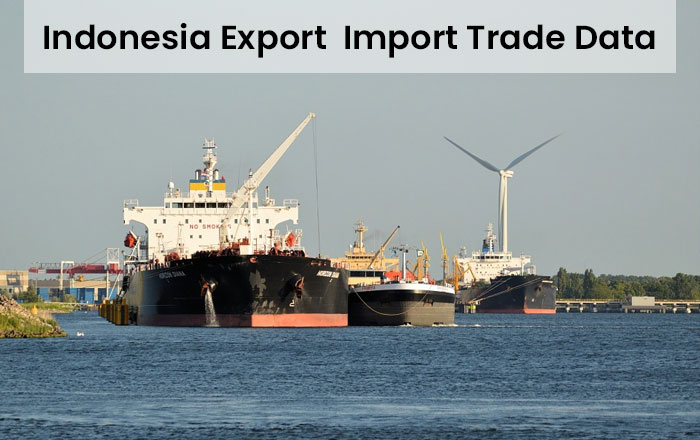
Indonesia is a large archipelago has more than 17,500 islands. Today Indonesia is the largest economies in South-East Asia. It has the 10th largest economy in terms of purchasing power parity. Indonesia is a member of the G-20 countries and is considered a newly industrialized country. Indonesia is also a member of ASEAN. Indonesia has made tremendous improvements in their economic situation and has achieved poverty reduction of 9.4%. The annual growth rate of Indonesia fluctuates at around 5%. Japan is one of Indonesia’s main trading partners after the Japan-Indonesia trade agreement was signed in 2008. Other major trade agreement signed by Indonesia as a member of ASEAN was between China, Australia, and New Zealand, India, Japan, and Korea. Indonesia also signed a trade agreement with Pakistan.
Indonesia is blessed with many natural resources such as crude oil, tin, coal, copper, and gold. Indonesia's export-import data shows foreign trade accounts for 43% of its GDP. In 2019 total imports from Indonesia were 154.6 billion USD while exports were at 180.2 billion dollars. In 2018 Indonesia recorded a trade deficit of 8.4 billion dollars.
Indonesia's export-import data is collected from the customs port around Indonesia. The data is compiled from the information available in the shipping manifest and bill of lading. The export-import data usually contains the following information:-
Indonesia's export-import data is an extremely important business tool and is used to formulate business strategy. Importers and exporters can analyze changing consumer tastes and preferences. Exporters can find new emerging markets while importers can find alternative places to source their material. Exporters can use the information in the database to price their products competitively. Importers can use the information for negotiation. The landed cost of the product and custom duties applicable can be calculated. The data can provide excellent first point contact between potential buyers and sellers. Manufacturers can use the database to procure their raw material at the best price. Logistic companies and bankers can use the database to look for new clients. Alternative countries to import and export can be found in case of changes in governmental or international policies.
Indonesia’s export-import data is analyzed by government agencies while formulating fiscal, foreign, and industrial policies. International agencies use the data to rate the growth prospects of Indonesia.
According to Indonesia export data, the country exported 180.2 billion dollars worth of goods. 3912 products were exported by Indonesia. There were 214 export partners. Indonesia is the 25th largest exporter in the world. The last five years have seen a decrease in exports by 2.5% annually. The first three months of 2020 have shown imports of 14.09 billion USD. Sale of gas and oil fell by 40.91% and the sale of mining products saw a drop 43.65%. Meanwhile, non-oil and gas exports rose by 3.38%. The first three months of 2020 have shown an increased sale of 2.91%.
The main products exported from Indonesia are:-
Analyzing the electrical machinery and equipment was the fastest growing sector and exports grew by 50.5% from 2019. The second fastest export sector was footwear. The third fastest-growing sector was the iron and steel sector. While animal or vegetable fat, oils, and faxes showed the steepest decline at 32.3%.
Analysis of the Indonesia export data showed that 72% of Indonesia’s exports are from Asia. 11.3% of exports were sold to the North American continent. This was followed by the European continent with 10.6% of the exports.
The top exporting partners of Indonesia are:-
According to Indonesia import data, Indonesia imported 156.4 billion dollars in 2019. Indonesia is the 29th largest importer in the world. Indonesia imported over 4411 products from around the world and had 224 importing partners. Imports in the country fell annually at a rate of 3.9%. The import data of Indonesia till March 2020 showed 13.35 billion USD and showed a decline of 7.88%. Purchases of non-oil and gas were down 1.56% to 11.74 billion. Meanwhile, imports of oil and gas grew at 5.64% at 1.61 billion. The first three months of 2020 have shown a contract of 3.69% when compared to the data of 2019.
The major products imported to Indonesia are -
Indonesia’s top 10 imports accounted for two-thirds (63.8%) of the overall value of its product purchases from other countries. Optical, technical, and medical apparatus represents the fastest grower among Indonesia’s top 10 import categories, up by 34.7% from 2018 to 2019. The other product category to appreciate was the articles made from the iron or steel machinery category which rose 6.4% year over year. Posting the steepest decline in Indonesia’s imports were in mineral fuels including oil (down -49.5%), iron and steel (down -28.7%), and organic chemicals (down -23.7%).
The top importing partners of Indonesia are:-
Analysis of Indonesia’s importing partners showed that 74.9% of Indonesia imports were from Asia, Europe accounted for 9.5% of Indonesia’s imports while 6.5% of commodities were imported from North America.
Indonesia has over 17000 islands and ports are extensively used to transport goods from the islands. However, most ports in Indonesia are considered inefficient and outdated as they struggle to cope with the influx of traffic. The three busiest ports in Indonesia are:-
TEU is twenty foot equivalent unit.
Seair Exim Solutions is a leading export import data provider company. It offers updated, 100% genuine, and reliable global trade data of more than 80 countries of the world such as India, USA, Russia, Kenya, Mexico, Indonesia, Sri Lanka, Vietnam, Pakistan etc. Our major services are USA imports data, import data India , India export data, import data Indonesia, Vietnam export data, Russia customs data, Mexico trade data, Kenya shipment data etc. You can find various free resources related to import export business like HS codes list, HS code finder, HS code Search, sac code list, sac code finder, custom duty in India, custom duty calculator, foreign ports, trading partners of India, GST rates in India, GST rates list and many more on our website –seair.co.in.
For free sample data report and free live demo data search
Phone No: +91-11-41325515, +91-9990020716
Email Id- Info@seair.co.in
We have successfully served many reputable clients for Import-Export Data Information Services. Here are some of our clients:
Copyright © 2009 - 2024 www.seair.co.in. All Rights Reserved.


Leave a Comment